Finding the centre of Jamaica.
April 24, 2026 • By Rhys • 7 min read
Family meetups are often times for catching up and discussions. One such discussion that occurred recently was that Portmore was taking over from Kingston as the centre of Jamaica. Now, as someone who was “born under the clock” and spent his formative years in a 9 sqkm area of the City of Kingston (not the parish) and had all intentions of living in that same area, the notion that Portmore is “taking over” as the centre of Jamaica is ludicrous.
Portmore, a municipality in the parish of St. Catherine, has grown quite a bit in the last 3 decades. I recall when the citizens of Portmore would still need to drive into Kingston across the causeway bridge or via Mandela Highway to conduct most of their business. And while banks and supermarkets opened branches fairly early on, as recently as a decade ago, Portmorians would still venture across parish lines for most forms of entertainment and socializing. This has changed drastically in the last decade though. In the same way that I could live comfortably in that 9 sqkm section of Kingston I reckon someone born in Portmore could do the same today. Well…except for being born there. The one thing still missing is a major hospital. Citizens of Portmore still rely on hospitals in Spanish Town or Kingston. Kingston still is the economic and cultural centre of Jamaica. But, let’s take out the economics and culture…where is the centre of Jamaica and how has it shifted over the years?
And I mean just from a population perspective.
By centre I mean the population-weighted geographic centre of Jamaica: the point where each parish pulls proportionally based on its population. Imagine each parish pulling on a map with a force proportional to its population; that the balance point is the centre.
The Setup
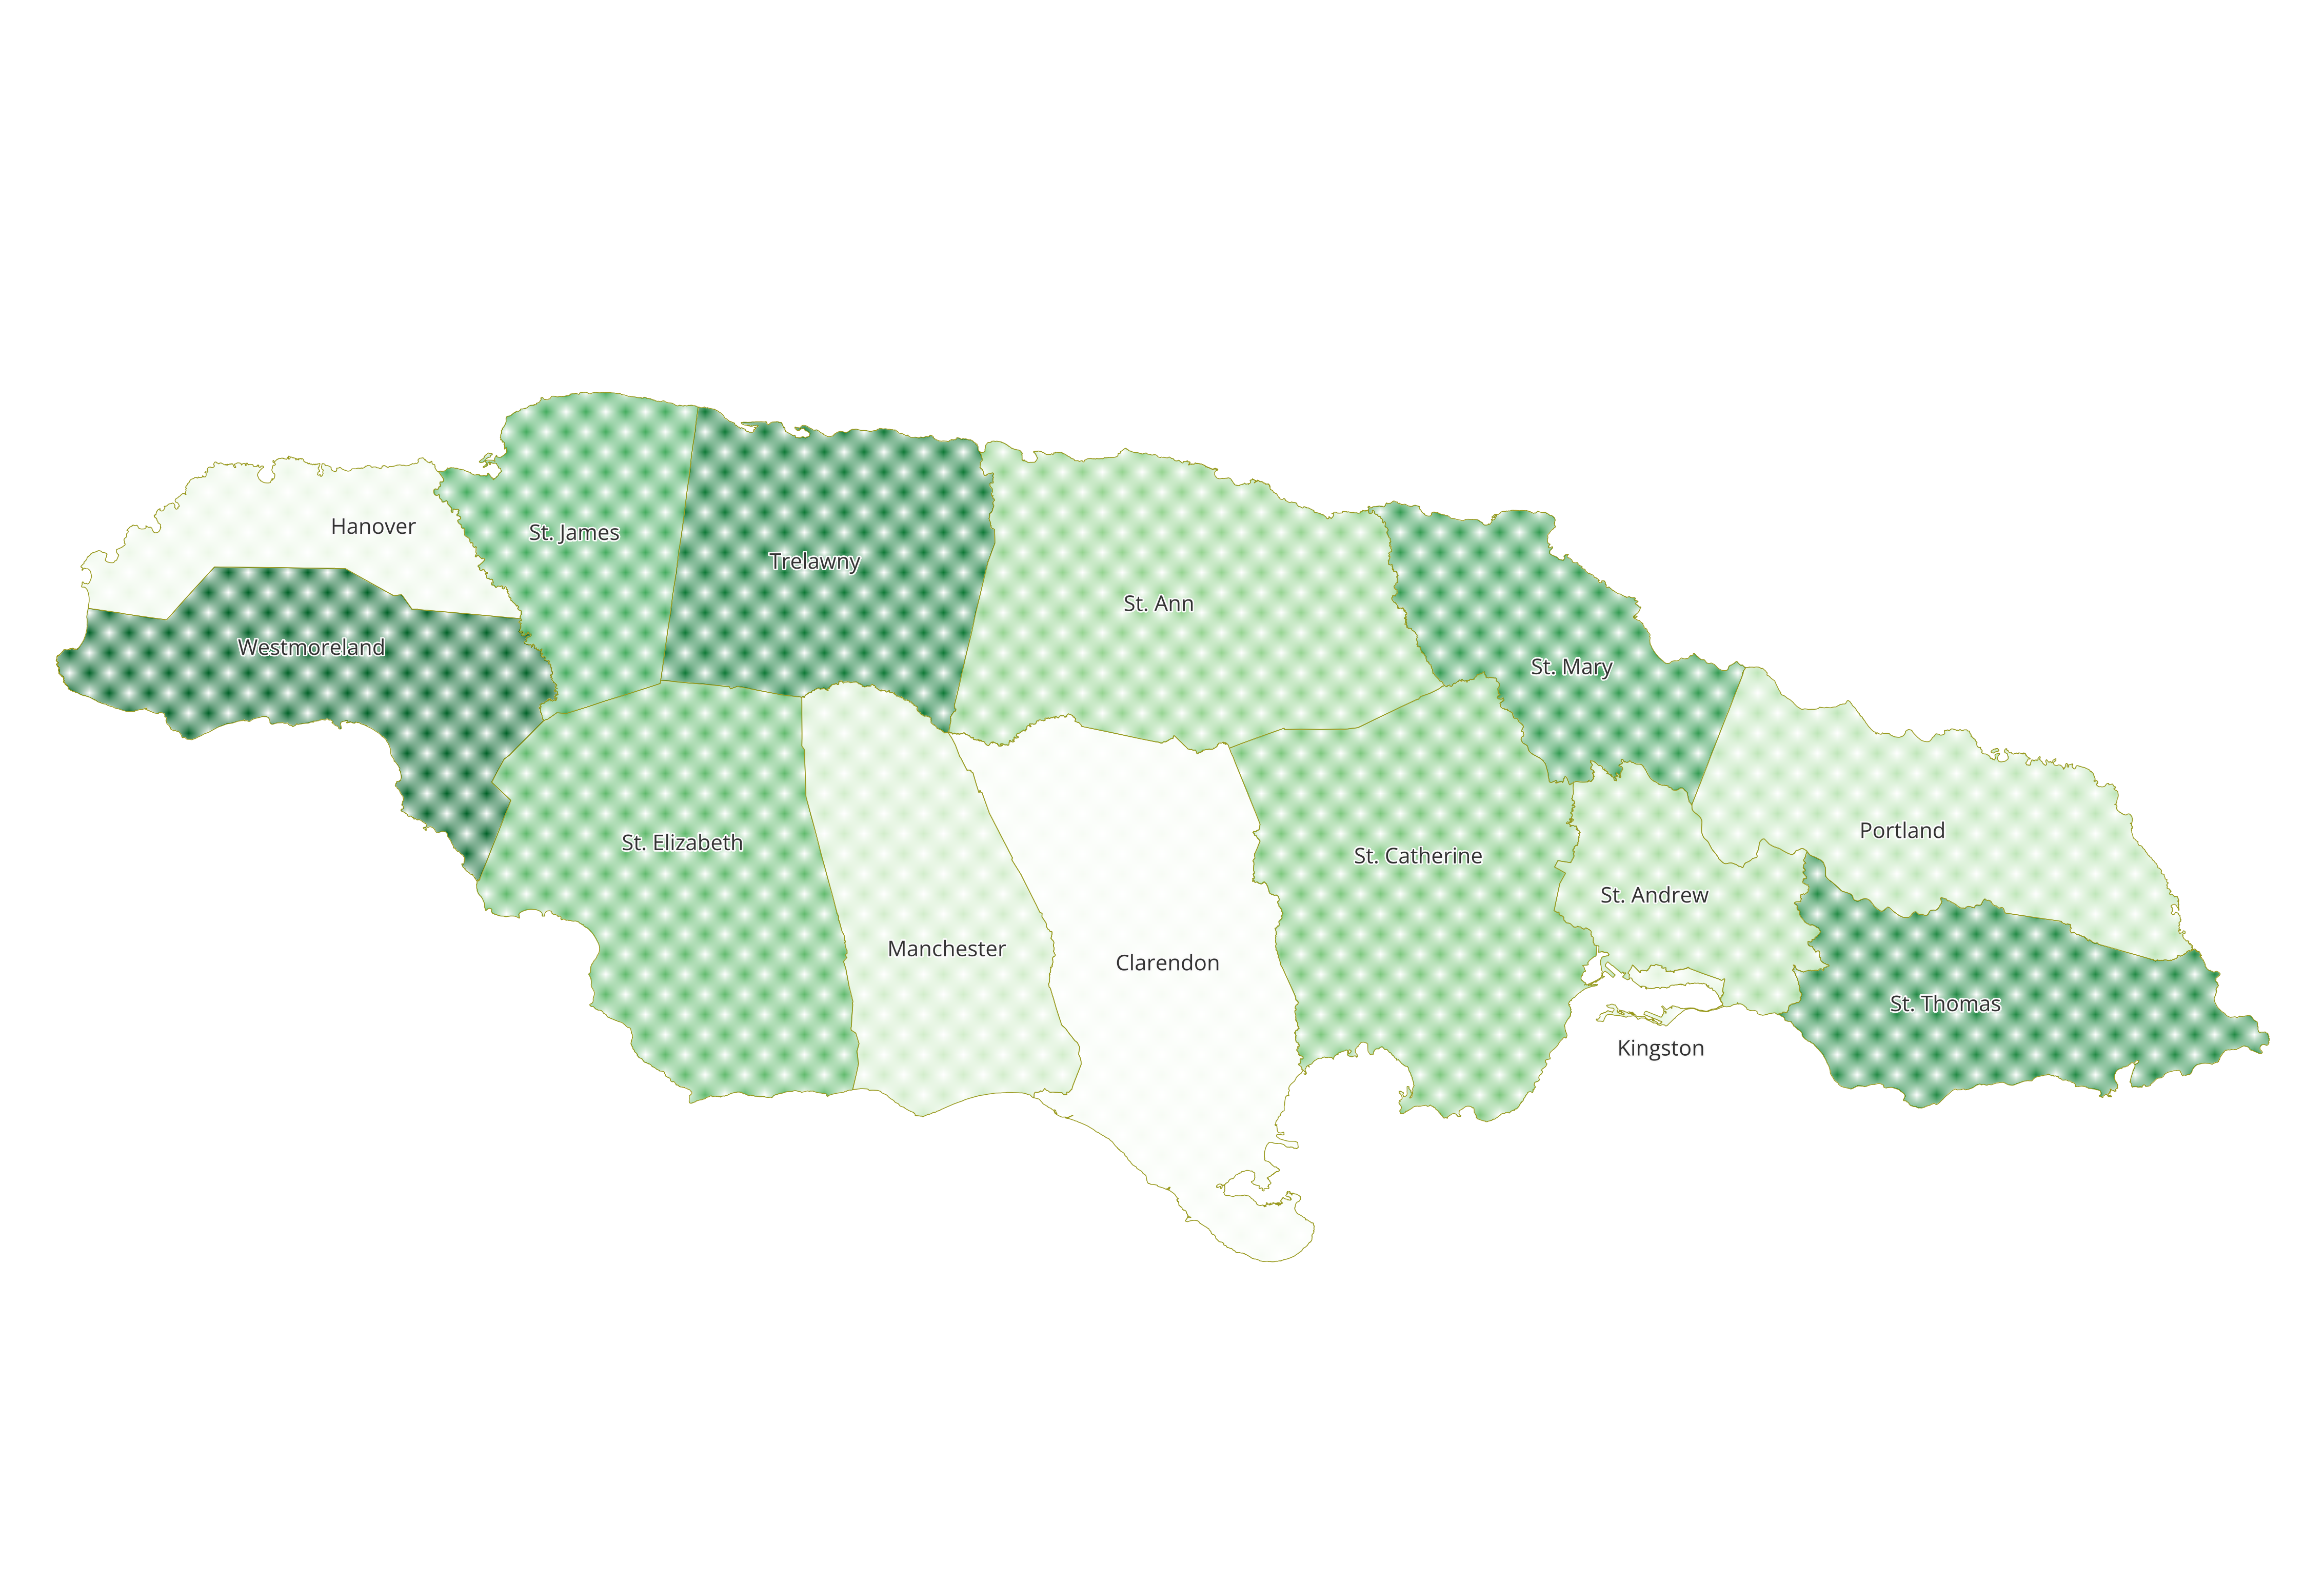
So, a bit of background, Jamaica has 14 Parishes. The capital of Jamaica is Kingston. There are two Kingstons. Kingston the city and Kingston the Parish. The city of Kingston includes the parish of Kingston and a substantial portion of the parish of St. Andrew. St. Catherine, in addition to hosting Portmore also has Spanish Town and Old Harbour as relatively large population centres. My expectation is that the centre, again from a population perspective, is somewhere in St. Catherine. I could not find any official boundary data for the city of Kingston or the municipality of Portmore. For this analysis, I am going to stick to the parish population figures. I’m using data from https://www.citypopulation.de/en/jamaica/ since data.gov.jm looks as if it has not been updated in eons and the official Statistical Institute of Jamaica website doesn’t have a simple table with the data I need.
Source: citypopulation.de (compiled from STATIN, UN Demographic Yearbook 1988, CARICOM National Census Report 2001)
| Parish | Abbr. | Capital | Area (km²) | 1982 | 1991 | 2001 | 2011 | 2022 |
|---|---|---|---|---|---|---|---|---|
| Clarendon | CLA | May Pen | 1,198 | 203,132 | 214,706 | 237,024 | 245,103 | 258,643 |
| Hanover | HAN | Lucea | 451 | 62,837 | 66,104 | 67,037 | 69,533 | 69,780 |
| Kingston | KIN | Kingston | 22 | 104,041 | 103,771 | 96,052 | 89,057 | 89,186 |
| Manchester | MAN | Mandeville | 837 | 144,029 | 159,603 | 185,801 | 189,797 | 193,694 |
| Portland | POR | Port Antonio | 814 | 73,656 | 76,317 | 80,205 | 81,744 | 84,972 |
| St. Andrew | AND | Kingston | 435 | 482,889 | 535,872 | 555,828 | 573,369 | 583,718 |
| St. Ann | ANN | St. Ann’s Bay | 1,205 | 137,745 | 149,424 | 166,762 | 172,362 | 175,310 |
| St. Catherine | CAT | Spanish Town | 1,194 | 332,674 | 381,974 | 482,308 | 516,218 | 542,763 |
| St. Elizabeth | ELI | Black River | 1,204 | 136,897 | 145,651 | 146,404 | 150,205 | 153,201 |
| St. James | JAM | Montego Bay | 593 | 135,959 | 154,198 | 175,127 | 183,811 | 188,656 |
| St. Mary | MAR | Port Maria | 612 | 105,969 | 108,780 | 111,466 | 113,615 | 116,498 |
| St. Thomas | THO | Morant Bay | 743 | 80,441 | 84,700 | 91,604 | 93,902 | 94,485 |
| Trelawny | TRE | Falmouth | 871 | 69,466 | 71,209 | 73,066 | 75,164 | 77,427 |
| Westmoreland | WML | Savanna-la-Mar | 788 | 120,622 | 128,362 | 138,947 | 144,103 | 146,205 |
| Total | 10,967 | 2,190,357 | 2,380,666 | 2,607,632 | 2,697,983 | 2,774,538 |
So, let’s get the data set up. I already have a table with the parishes in jamaica.parishes. Let’s create a schema and add a table to hold the data from citypopulation.de
CREATE SCHEMA demography;
CREATE TABLE demography.jamaica_parish_population(
  parish text,
  short_name text,
  capital text,
  area_sqkm float,
  pop_1982 int,
  pop_1991 int,
  pop_2001 int,
  pop_2011 int,
  pop_2022 int);

COPY demography.jamaica_parish_population FROM 'citypopulation.de.jamaica.parish.csv' WITH (HEADER, FORMAT CSV);
While this is nice to look at it is a bit unwieldy to work with. So let’s unspool this into a standard table.
CREATE VIEW demography.parish_pop_by_year AS
SELECT parish, year, pop FROM demography.jamaica_parish_population
CROSS JOIN LATERAL (VALUES
  (1982, pop_1982), (1991, pop_1991), (2001, pop_2001),
  (2011, pop_2011),  (2022, pop_2022)
  ) AS unrolled(year, pop) ;
The Centres
So now that we have the data we need. How do we find the centre? The first thought that popped into my head was to use PostGIS’ st_centroid function. I also remembered that the st_geometricmedian function also exists, which up until today, I had never used. Let’s look at both functions and compare the end result.
The st_centroid function gives you the centre of mass of a geometry, however, given that the parish geometries are not changing, we need a way to represent the population of each parish in a way that st_centroid can take advantage of. We can use the population density of each parish to generate that many points inside a 1km square centred on the parish, then run st_centroid over the combined set of points. This is much faster than generating one point per person.
The st_centroid Approach
CREATE TABLE demography.population_centre_centroid AS
WITH population_density_data AS (
  SELECT parish, year, pop/(st_area(geom)/1e6) pop_density, geom FROM jamaica.parishes
  JOIN demography.parish_pop_by_year USING (parish)
),
weighted_points AS (
  SELECT parish, year,
  st_generatepoints(
    st_translate( --st_square needs to be shifted because it is not centred
      st_square(1000,0,0,st_centroid(geom)),
    -500, -500),
  ceil(pop_density)::int) wp
  FROM population_density_data
)
SELECT year, st_centroid(st_collect(wp)) geom FROM weighted_points
GROUP BY year;
A couple things to note, I need to use st_translate because the st_square function doesn’t centre the square on the supplied point as I thought it would.
The st_geometricmedian approach
The st_geometricmedian function is based on Weiszfeld’s algorithm to find the geometric median, which as opposed to the centroid being the “centre of mass” of a geometry, is the point that minimizes the sum of the distances to all other points. This function also has the ability to use the M value to give each point a relative weight. We can apply the parish population as the M value using st_force3dm.
CREATE TABLE demography.population_centre_median AS
WITH population_density_data AS (
  SELECT parish, year, pop, geom FROM jamaica.parishes
  JOIN demography.parish_pop_by_year USING (parish)
),
weighted_points AS (
  SELECT year, st_geometricmedian(st_collect(st_force3dm(st_centroid(geom), pop))) wp
  FROM population_density_data
  GROUP BY year
)
SELECT year, wp FROM weighted_points;
The Results
Ok, so, let’s take a look at the point spread:
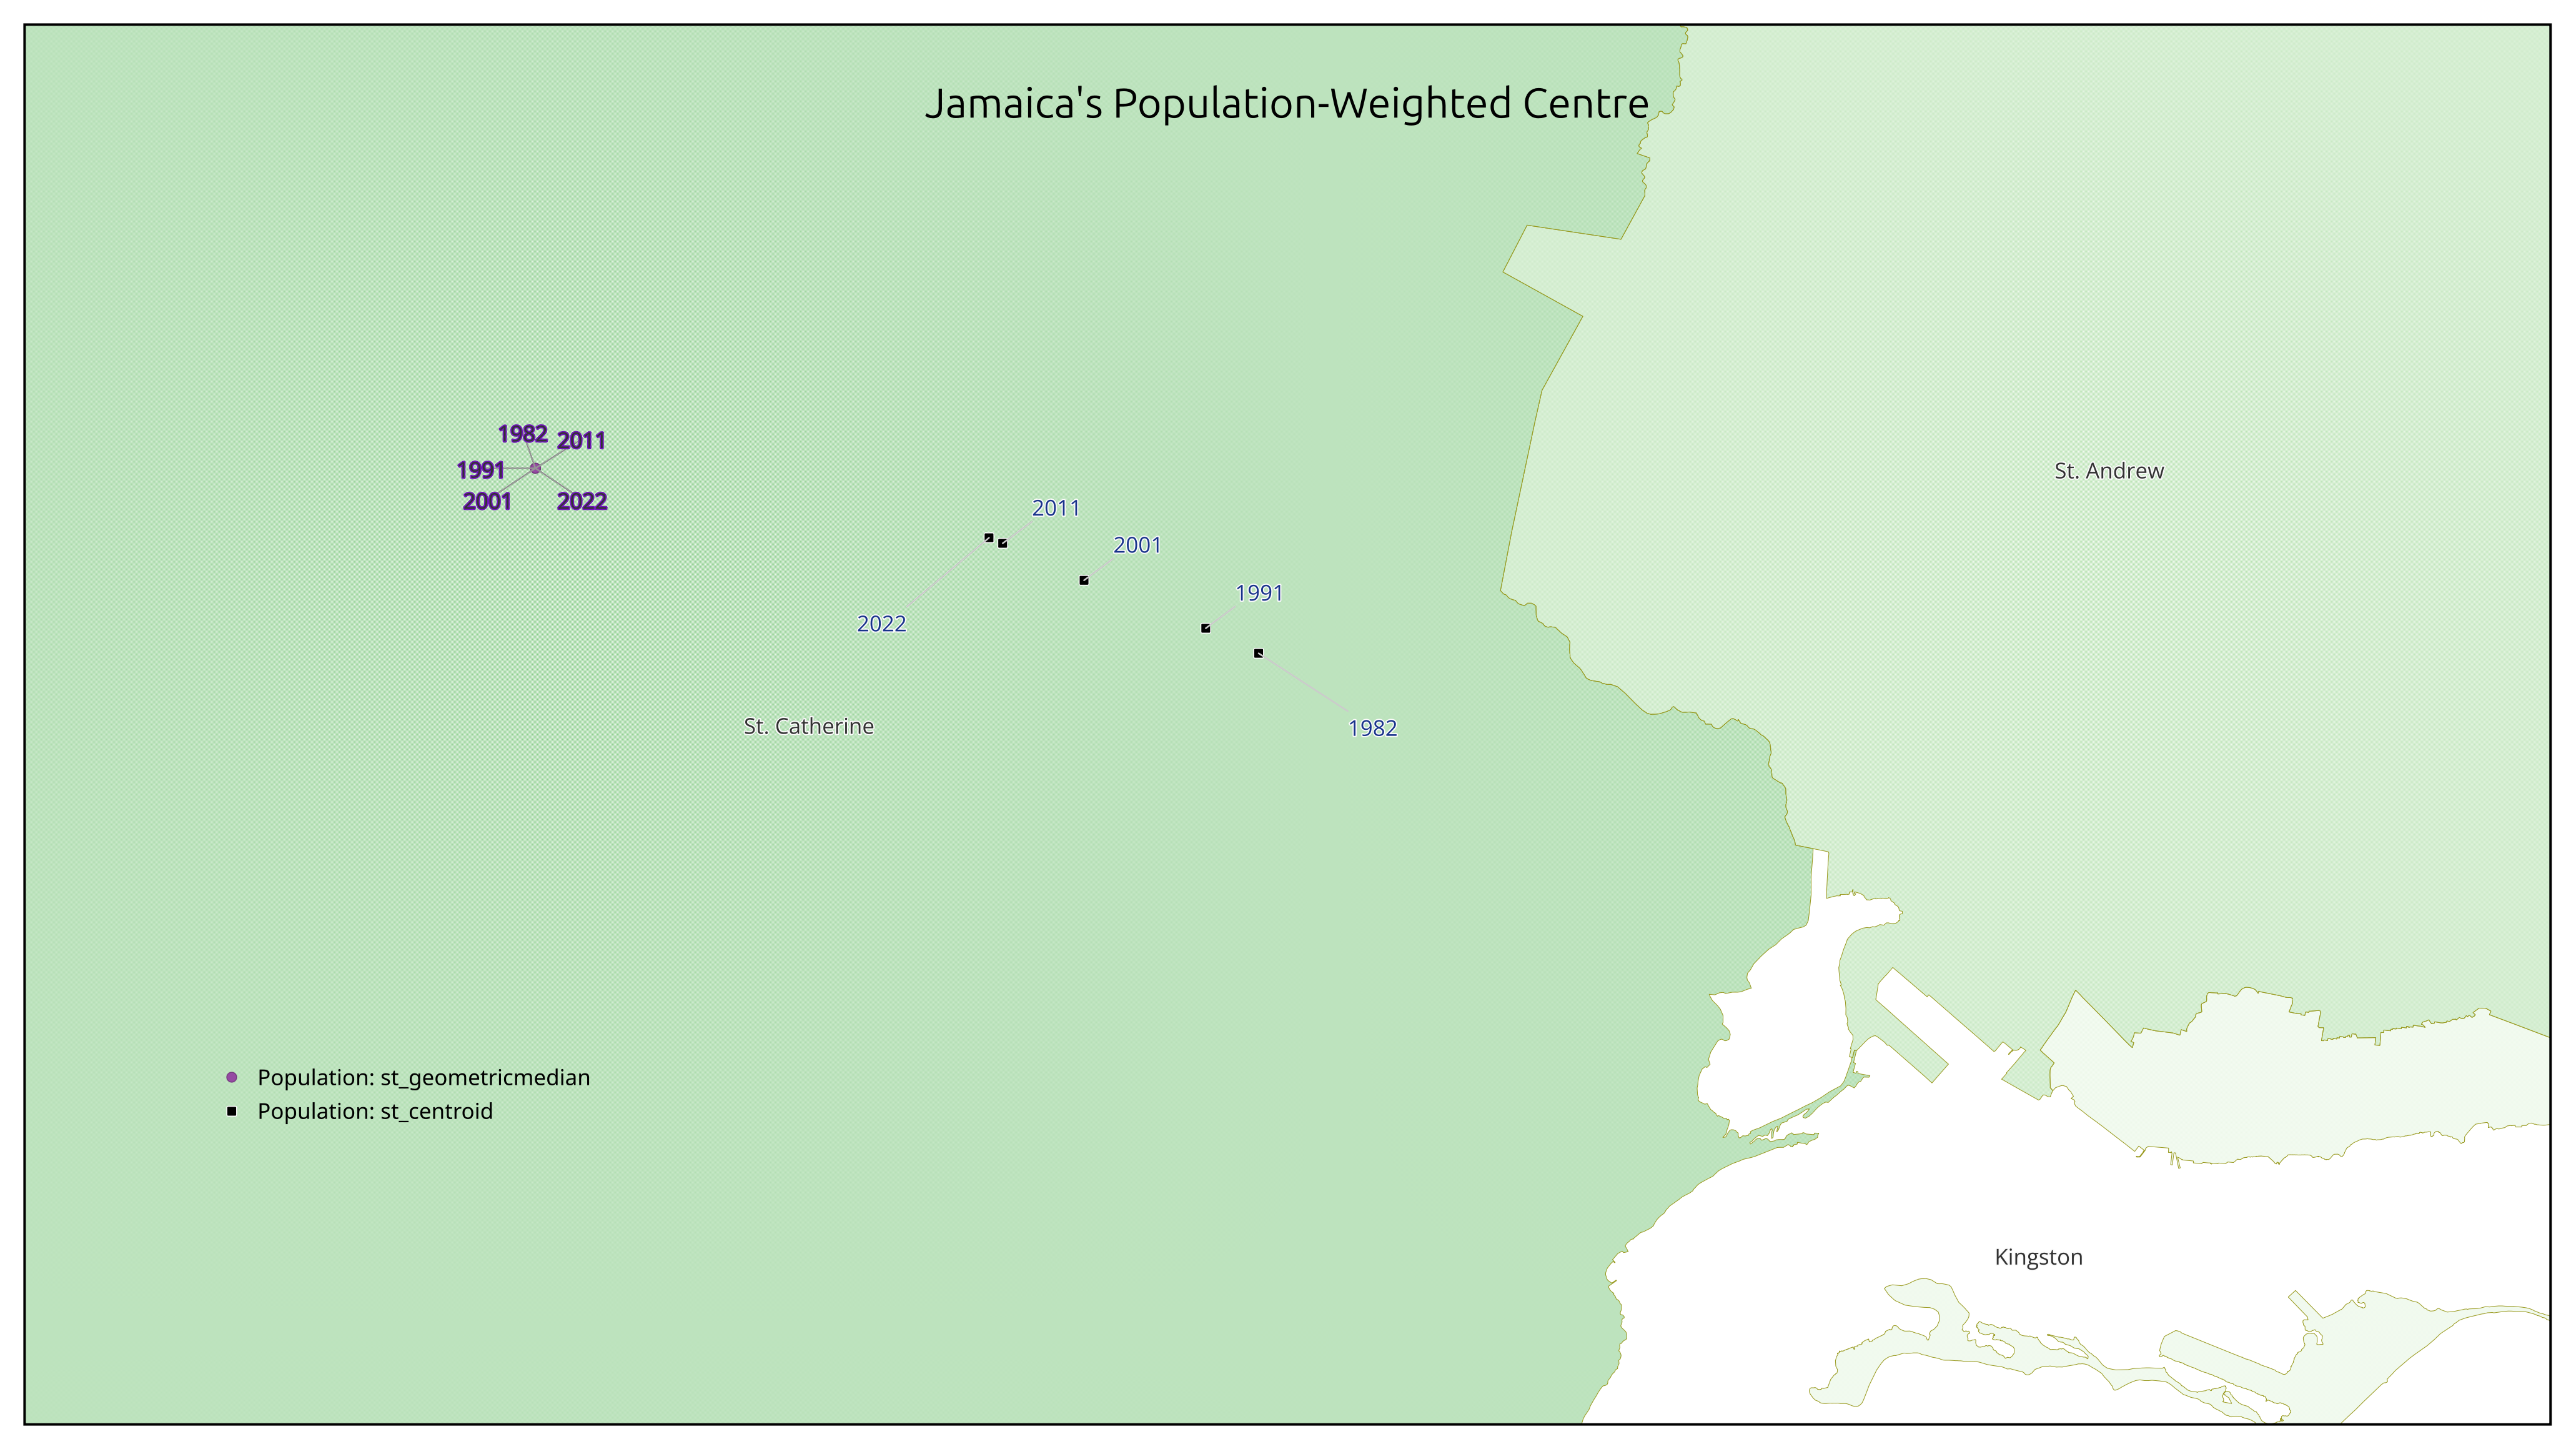
Initially I was shocked at the fact that the st_geometricmedian points were all clustered at the same place. It looks as if the M value weighting is not that impactful, maybe because the change in population between census years is relatively small. St. Catherine, for example, even though it has the highest growth over the 4 decade period, only increased as a percentage of total population from ~15% to ~20%. Also, given that the function is less sensitive to outliers, this may also explain why the movement between years is limited. The geometric median minimises absolute distances rather than squared distances, and with 14 fixed points spread across the island, that spatial configuration overwhelms the modest weight redistribution between censuses.
The st_centroid points however, respond like a seismograph: every change of population is clearly noticed. The overall trend from the st_centroid function mirrored what my expectations were: there is a general trend north-westward as the population of St. Catherine increases.
Is Portmore Taking over?
The data says no. Jamaica’s population-weighted centre in 1982 was just west of the border between St. Catherine and St. Andrew. The direction of travel is telling: every decade it jogs further west away from Kingston. The suburban wave that fuelled growth in Portmore and to a lesser extent the towns and areas around Old Harbour has shifted the balance point. If I had more granular data, i.e. data at the community or enumeration district level for each of the census years, I think the centroid would trend in the direction of Portmore on a more south-westerly heading as opposed towards the interior of St. Catherine. That however is a post for another day if STATIN releases that kind of data for all previous censuses. In fact, it would be good if STATIN could release all data at the ED level. It would be interesting to see things like income distribution across the island.
In the meantime, I have my answer for the next family linkup. Kingston is still the centre of Jamaica. PostGIS said so.